Transgender Identification on US College Campuses at an All-Time High
There are conflicting reports regarding current trends in transgender identification among youth. Some recent commentaries reported plummeting rates of transgender identification among US youth, and a European newspaper declared "the gender revolution is over." Yet SEGM's reanalyses identified serious methodological limitations in those original analyses, rendering their conclusions unreliable.
Our analysis of US college data, subsequently referenced by the New York Times, indicated that, as of spring 2025, the rates of trans identification on US campuses were at an all-time high, although possibly reaching a plateau.
We have now updated our analysis with data through the end of 2025. The new data suggest that our previous conclusion of a possible plateau was premature. Instead, we see yet another increase in trans identification, with 9% of females and 5% of males on undergraduate campuses reporting a sex-incongruent gender identity—an all-time high. We present our detailed findings below.
Note: The source of our analysis is the American College Health Association's National College Health Assessment (NCHA), which is a large sample from US colleges and graduate schools. NCHA has surveyed 2.5 million students at more than 1,000 higher-education institutions over the last 26 years, repeating the survey every spring and fall. To date, this represents the most robust dataset of US college students.
Summary:
- Transgender identification on US college campuses is at an all-time high and has increased 37-fold since 2000.
- 9% of female and 5% of male undergraduates have a sex-incongruent gender identity.
Nonbinary identities outnumber binary trans identities by roughly 3 to 1.
1. The rate of transgender self-identification is currently at an all-time high
The most straightforward way to establish the trend in transgender identification is to rely on the self-reported answer to the question regarding one's identity as "transgender." Such a question has been part of the NCHA survey since its inception in 2000, although the question and answer wording underwent several changes.
According to this question, 5.2% (just over 1 in 20) of college students self-identify as transgender as of fall 2025 (see Figure 1).
Figure 1
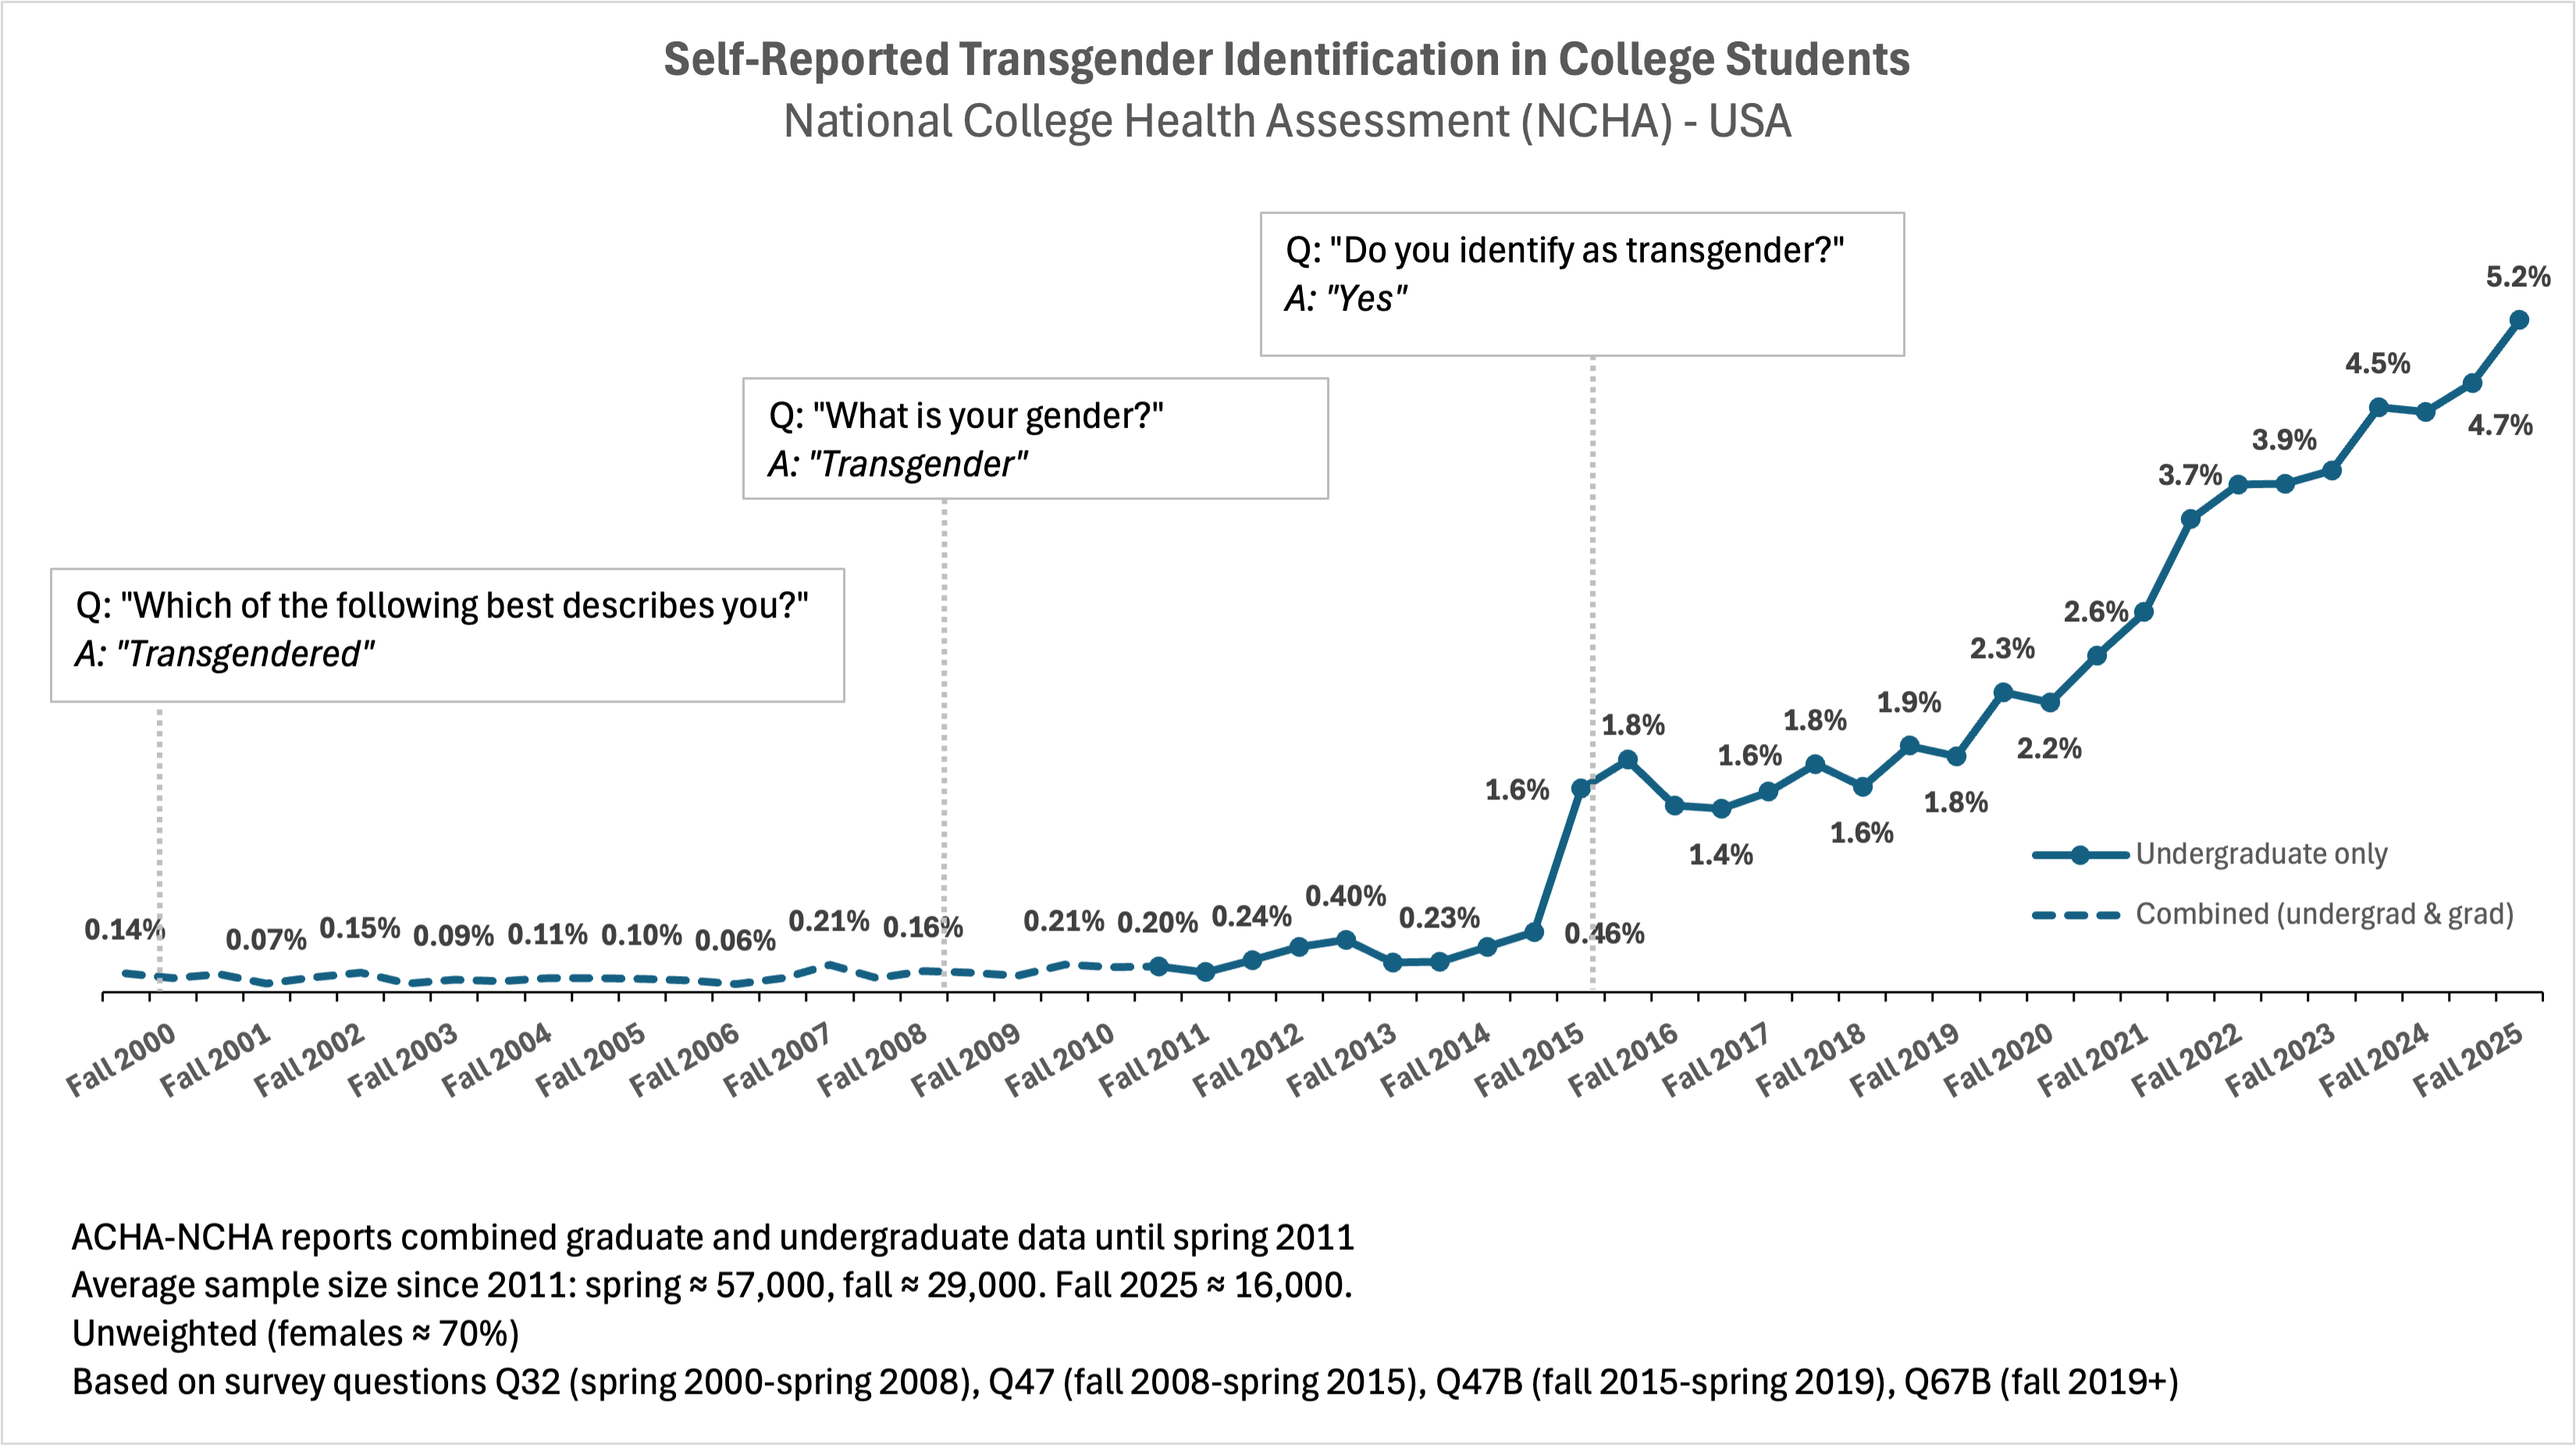
It remains unknown how much of the 2015 increase is attributable to the change in question wording. Previous versions of the survey asked about gender in general, with "transgender" as one of the response options; starting in fall 2015, students were asked directly, "Do you identify as transgender?" However, as these are the best available data, we report the full series, which indicates a 37-fold (3,600%) increase in transgender identification since 2000.
2. Females are more likely than males to report a sex-incongruent identity
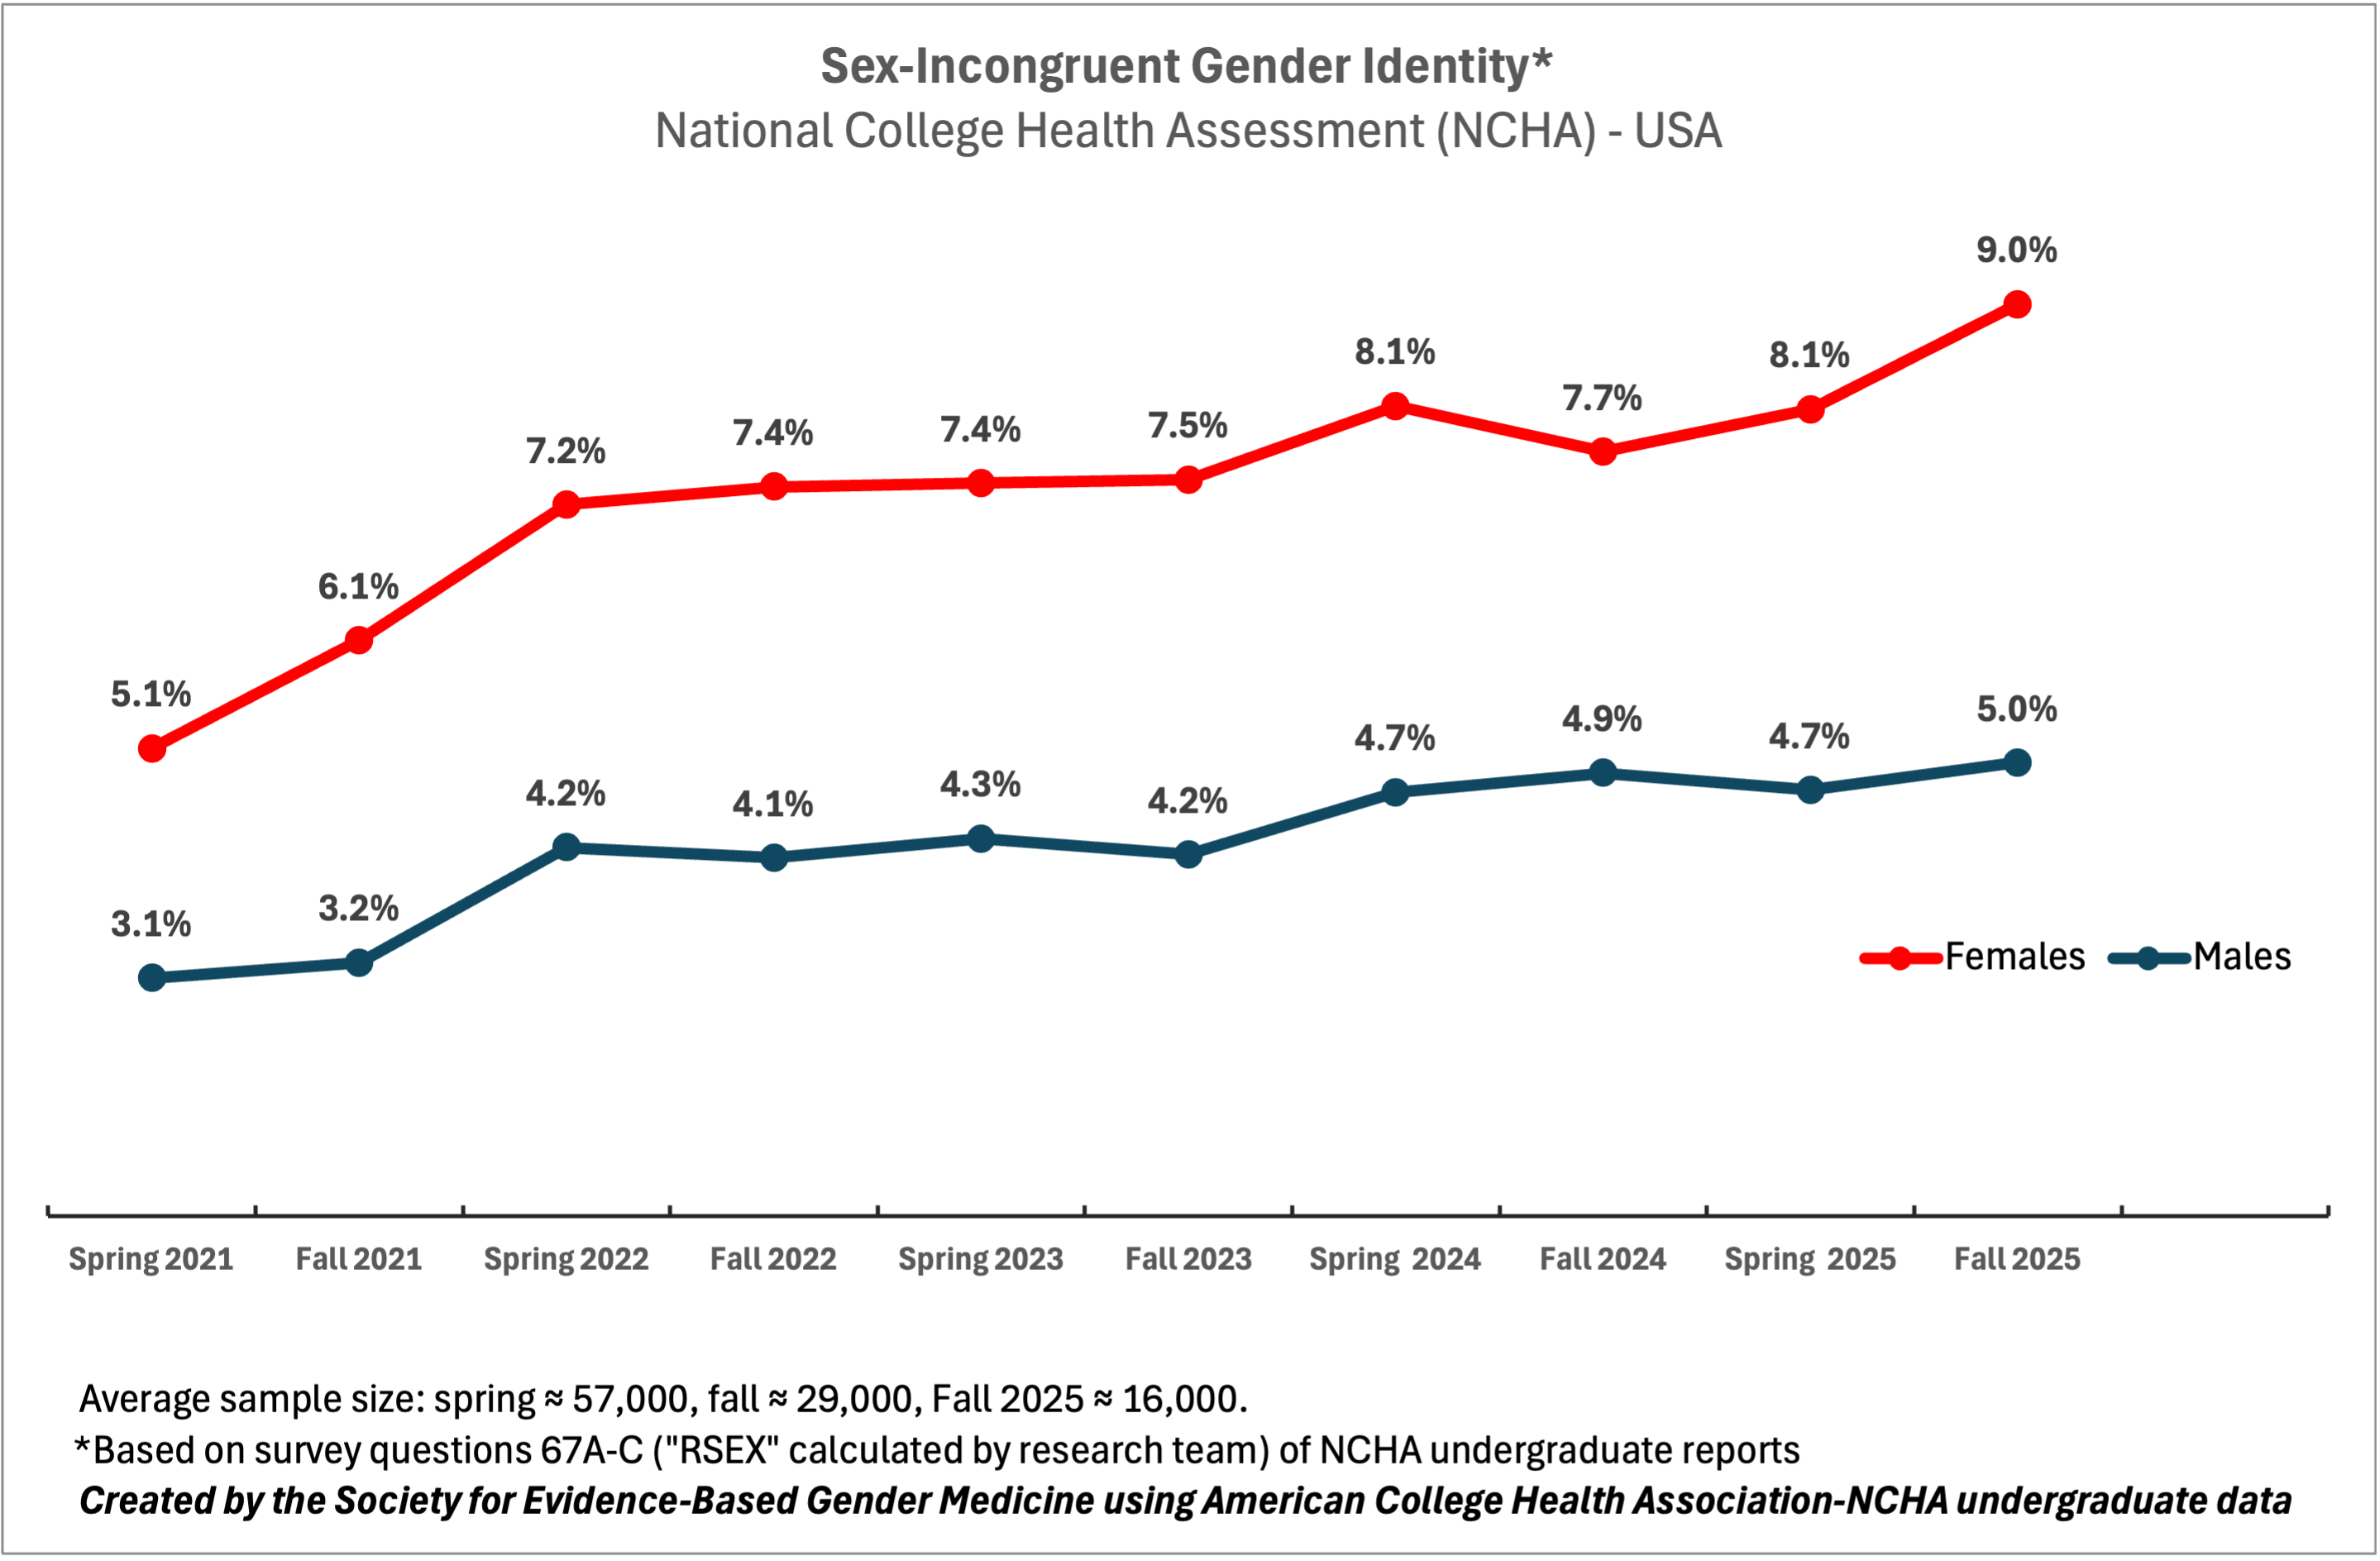
In addition to a direct question about one's self-identification as "transgender," the NCHA survey also provides a calculated measure built on a comparison of the respondents' self-reported sex and gender identity. A mismatch between the two indicates a sex-incongruent identity (see questionnaire design below). By this measure, 9% of college females and 5% of males have a sex-incongruent identity as of fall 2025. The rate among females is nearly double that of males (see Figure 2).
Figure 2
3. Nonbinary identities dominate—but have reached a plateau
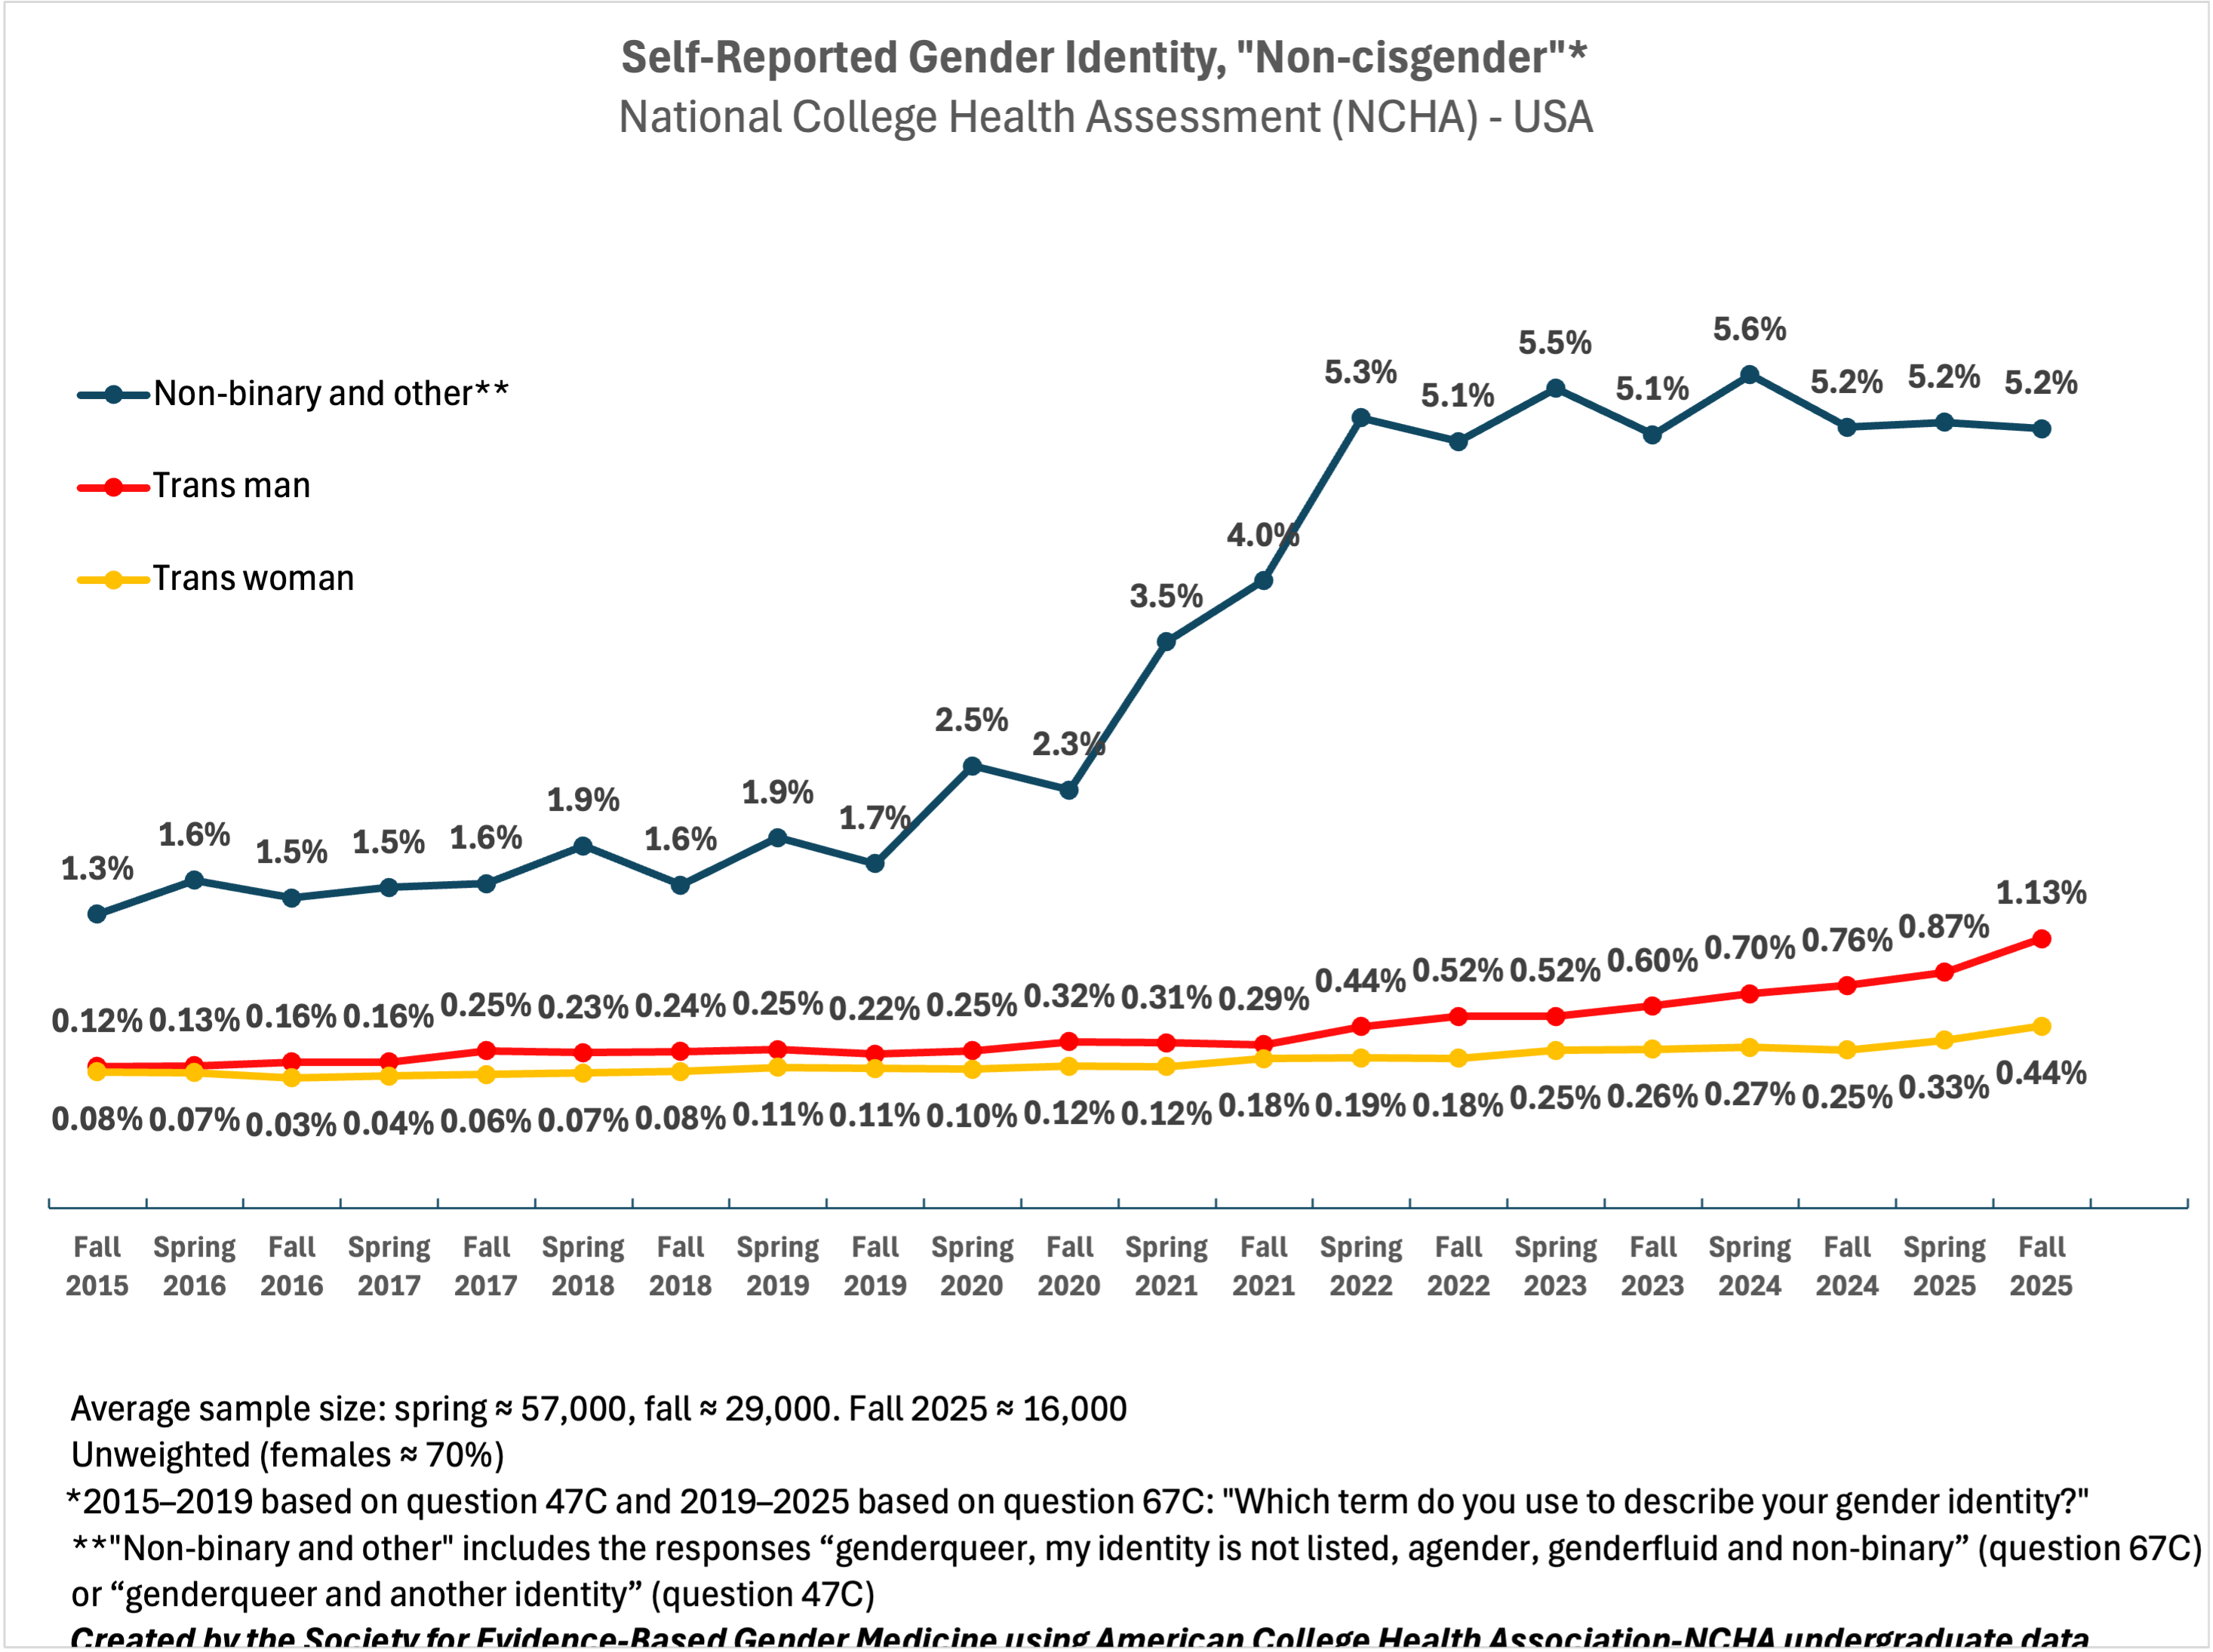
The data indicate that nonbinary transgender identities outnumber binary transgender identities roughly 3:1 (see Figure 3). The trends differ between binary and nonbinary trans identities. While "trans man" and "trans woman" identities have continued to increase since 2015—with yet another increase in the fall of 2025—"nonbinary" identities have plateaued since approximately 2022. As of fall 2025, these identities are hovering at levels four times as high as a decade ago.
Figure 3
Conclusion: Trans identification in college youth is at an all-time high
As of fall 2025, transgender identification on US undergraduate college campuses is at an all-time high, with 9% of females and 5% of males identifying as transgender/nonbinary or otherwise sex incongruent. Nonbinary identities are dominating the trend but have plateaued. At the same time, cross-sex identities are continuing to increase.
Notably, the rate of transgender self-identification among undergraduates in our data is higher than that reported from CDC survey data for a comparable age group (18–24-year-olds) in the same year (3.7%–3.9% in 2022 in our data vs 2.8% in the CDC survey data). Several factors likely contribute to this difference. Our data are unweighted, and about 70% of respondents are female, a group with higher rates of transgender identification. In addition, our data reflect college students, whereas the CDC survey data are nationally representative of all young adults. It is likely that the rate of transgender identification is higher among college students than among young adults in general. At the same time, the numbers are close enough to consider the data a fairly reliable indicator of year-over-year trends.
Methodological appendix
Sample
The source of our analysis is the American College Health Association's National College Health Assessment (NCHA), which is a large sample from US colleges and graduate schools. NCHA has surveyed 2.5 million students at more than 1,000 higher-education institutions over the last 26 years. The respondents' average age is 20, and about 70% of respondents are female.
The survey is done every spring and fall, with the spring wave averaging 57,000 undergraduate respondents and the fall wave averaging 29,000. Participation varies from one survey period to the next and was lower in the most recent year: about 47,000 undergraduate respondents in spring 2025 and about 16,000 in fall 2025, compared with about 79,000 and 24,000 in 2024.
Questionnaire design
NCHA has measured transgender identification in three ways:
- A direct question about transgender identity (since 2000). NCHA has asked students about transgender identification since its inception in 2000, when it reported a prevalence of 0.14%. The question wording has changed twice. From spring 2000 through spring 2008, the question stated, "Which of the following best describes you?" with "transgendered" as one of the possible responses. From fall 2008 through spring 2015, the question wording was "What is your gender?" with "transgender" as one of the possible responses. Starting in fall 2015, the question wording changed to "Do you identify as transgender?" with a binary "yes/no" response.
- A question about the specific gender identity (since fall 2015). Another NCHA survey question asks participants, "Which term do you use to describe your gender identity?" Alongside "woman or female" and "man or male," students can also select "trans man," "trans woman," or nonbinary-type identities such as "non-binary," "genderqueer," "genderfluid," and "agender."
- A calculated variable, "RSEX" (since spring 2021). Rather than relying exclusively on identity-related self-reports, the researchers themselves classify students as "Cisgender" or "Trans/Gender Non-conforming" by comparing the answers to three questions: sex assigned at birth (Question 67A: male, female, intersex), the direct question in item 1 (Question 67B), and the gender identity question in item 2 (Question 67C) (see the spring 2021 ACHA report, p. 3). Consistency between the reported sex and the two gender identity questions leads to a "cisgender" designation. Any discrepancy triggers the "trans/gender non-conforming" designation. Therefore, this designation is best understood as a broad proxy for transgender identification. In our report, we refer to it as "sex incongruent" since "gender non-conforming" has several meanings, some of which are not supported by the methodology (e.g., someone merely dressing in a gender non-conforming way would not meet the definition of RSEX "gender non-conforming"—an actual discrepancy between self-reported sex and self-reported identity is necessary).
Limitations
These findings have limitations, largely stemming from the methodology for this sample (not all college campuses participated, the participating campuses differ from one survey period to the next, and students could self-select). One of the most obvious limitations is that female students were more likely to participate than male students. And, since female students were also more likely to report a transgender/nonbinary identity, the overall rate of transgender identification is likely overestimated. However, the female response bias appears consistent across recent years and is unlikely to distort the trend, which continues to climb.
In addition, the wording of the question about transgender identity has changed twice since 2000, and the NCHA survey cautions against comparing trends between versions of the survey.
We have also analyzed the spring 2026 data, which appear to continue the 2025 trend, but an unusually high share of respondents are missing answers to the sex and gender identity questions (more than 20% of undergraduate students, compared with about 1% in prior survey periods). We have notified ACHA and are withholding the spring 2026 data pending verification of the denominators.